
The following picture shows a series of CVs simulated for a slow (but chemically reversible) charge transfer process using different scan rates.
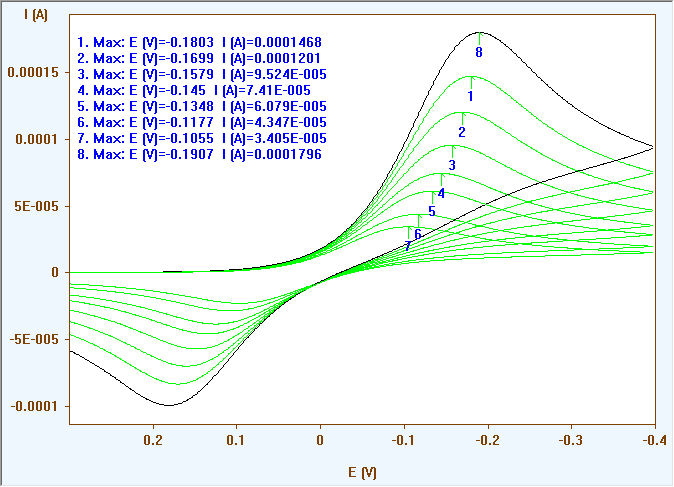
After retrieving height and position of the cathodic peak current by applying the Min/Max Info command the user may want to study
1.whether the peak heights depend linearly on the square root of the scan rate
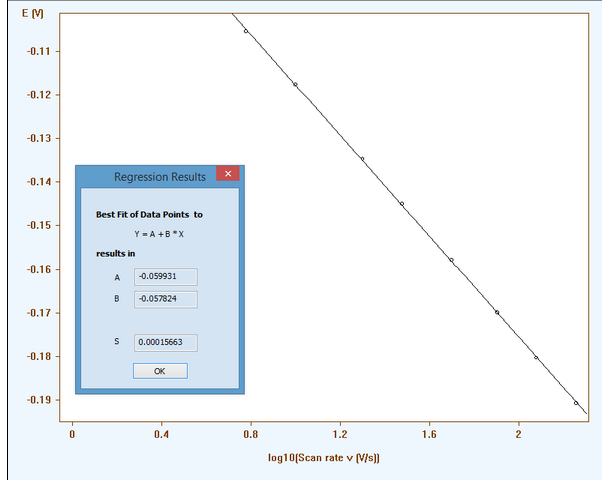
2.how the peak potential varies as function of the scan rate.
Both can be accomplished by clicking on the command button Plot Graph. It opens a dialog box
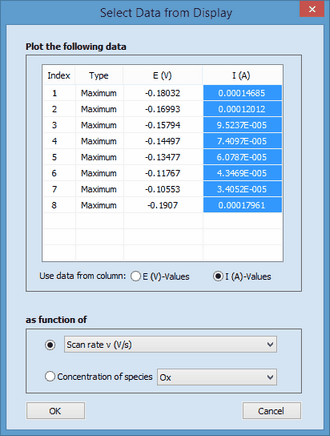
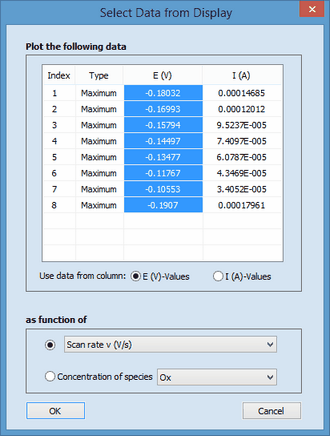
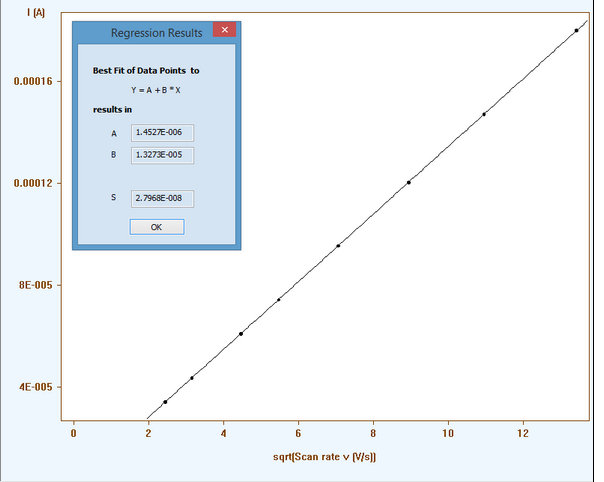
where the data in column I(A)-Values must be selected in the first case (see left picture) and those referring to E(V)-Values in the second case (see right picture). After clicking on OK the respective graph is shown on the Tab-Window: Plot Graph. When selecting y vs. sqrt(x) (case 1) and y vs. log10(x) (case 2), respectively, the following straight lines are obtained after applying the Ribbon Bar Command Linear in the Command-Group Fit Data.
Case 1:
Case 2:
Alternatively, I(A)-Values or E(V)-Values can be plotted as function of the electrode area or as function of the analytical concentration of a particular species. In the latter case the check-box Concentration of species must be activated and the name of the species must be selected in the associated combo box.
